Sept. '24 CPI: Not a Great Report, But is it Noise or a Narrative Change?
- CitizenAnalyst

- Oct 10, 2024
- 10 min read
Updated: Oct 11, 2024
My sense is the former, but let's go through the details.
Sept. headline CPI increased 0.2% (including food and energy) while core prices (which exclude food and energy) rose 0.3%. Both of these figures are on a seasonally adjusted, month-over-month basis. Unrounded, core CPI rose +30 bps on the month. This was slightly worse and in-line with expectations of about 0.2% and 0.3% for headline and core, respectively, but the devil is in the details here, and how we got to the 0.3% core increase is not as encouraging as it's been in recent months. On a year-over-year basis, headline CPI was up 2.4% (the smallest increase since September 2021), while core CPI inflation was up 3.3%, which was basically in-line with the last few months. Below is our usual table showing the last 13 months of CPI trends.
As we've argued in recent inflation posts, (see here and here) it's not always about the reported headline or core figures, but how we get there that really matters. Said differently, the building blocks are more important than the "aggregate" index figures. In recent months, core goods and services inflation has been either subdued, or otherwise at levels consistent with the Fed's 2% inflation target. This is in contrast to shelter inflation in the CPI, which has continued to indicate that the costs of housing are inflating at well-above pre-pandemic levels, and also well above levels indicated in other publicly available data sources. This has been encouraging because the Fed is aware of the lag in the CPI's shelter inflation mechanism, and that lag, viewed in tandem with the softer core goods and services inflation noted above, is the principal reason why the Fed became comfortable enough with the inflation picture that it started lowering interest rates at its last meeting in September.
This month the reverse seems to have been true: both goods and core services inflation rose at their highest rates in months, while shelter inflation increased at it's lowest rate since June (which itself was the lowest rate of increase since August of 2021). As hinted at above, however, the categories that seem to be the biggest culprits may not be ones that we need to worry about (either because they're already consistently inflationary, like medical care services, or because they're historically NOT consistently inflationary (though which can often be volatile), like used car prices, car insurance prices, apparel prices or airline fares). Let's look at our three buckets and assess. We're going to go in a slightly different order this month, so we'll start with goods, move to shelter, and then lastly come back to core services ex. shelter.
First, goods. This month goods contributed +4 bps to the overall +30 bps. This was the highest goods contribution since the middle of 2023.
But as shown in the chart above, despite the higher goods inflation this month, this ought to be kept in perspective. +4 bps is higher than the pre-COVID average of zero, but it's not anywhere close to even many of the spikes we saw in goods inflation pre-COVID (let alone the goods inflation we saw during COVID). Thus, while they were at least partially offset by declines in other categories elsewhere, the categories shown in the charts below were key culprits for the higher goods inflation this month. We are highlighting these outsized contributors this month because
Historically they have not been so
There's no reason to think they'll continue to be so in the future. If you don't believe me, pull up almost any stock chart of a discretionary retailer. No one thinks pricing power is back in any significant degree at all apparel, jewelry or bedding and furniture.
Consequently, it's probably fair to conclude that this month's CPI report in the goods department was more more likely to be "noise" than "signal." Also, for what it's worth, used car prices only contributed + 1 bps this month (compared to their historical levels of 0), so they were not really a factor.
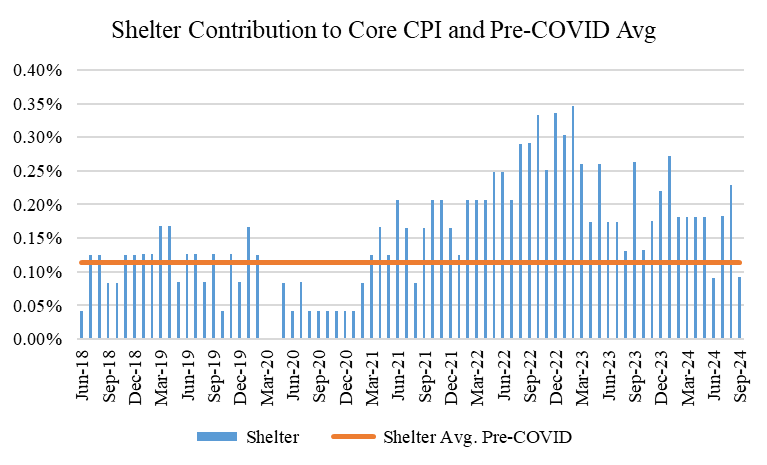
Let's now turn to shelter. Shelter has been the "stickiest" part of the CPI for a while now, though thankfully this month, it wasn't as much of a pain in our side as it's been in recent months, contributing only +9 bps to our +30 bps core monthly figure. This compares to the pre-COVID average of +11 bps, and was the lowest since June's CPI of this year (prior to June's +9 bps contribution, you had to go all the way back to August of 2021 to see monthly shelter inflation below that in the CPI). This was probably the most encouraging part of this month's CPI report, though perhaps not a major surprise given the lag dynamics we've talked about above (and in recent months). June proved to be a headfake in this regard, as shelter inflation in the CPI worsened again in July and August. But hopefully September is indicative that we're still on the way down, especially given rent inflation remains very low (if not negative) in other publicly available data sources.
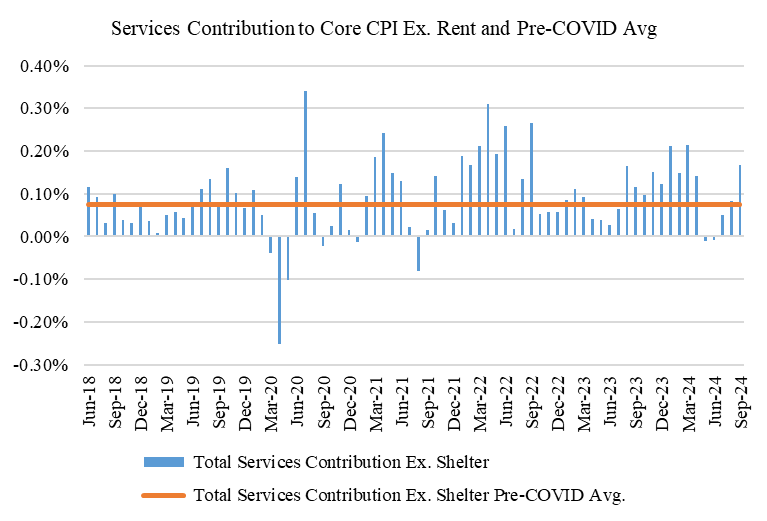
Now let's lastly take a look at core services. Core Services Ex. Shelter contributed +17 bps this month, a notable increase from recent months (and more in-line with reports from earlier this year). This is also well above the pre-COVID average of +7 bps. Among our three buckets, this was definitely the most discouraging of the three this month.
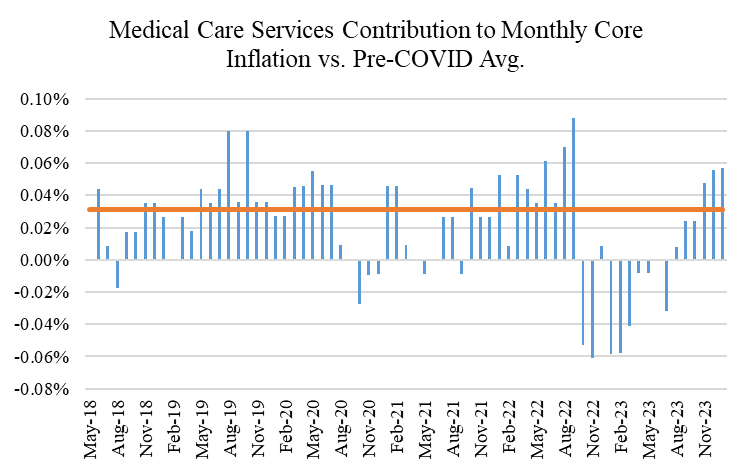
What drove the higher core services inflation? Several things. First and foremost, medical services was a big contributor, which added +6 bps to the overall core inflation figure this month. While this is somewhat elevated, and above the trends from late last year and earlier this year, this category historically has inflated at higher than "normal" rates. This excess in the last few months is therefore harder to "adjust out" of "trend" inflation. This could very well be structurally higher now than it was in the past (which wouldn't bode well for our health insurance bills), though time will tell. Maybe there were a few bps extra of headwind from Medical Services this month, maybe not. We'll see.
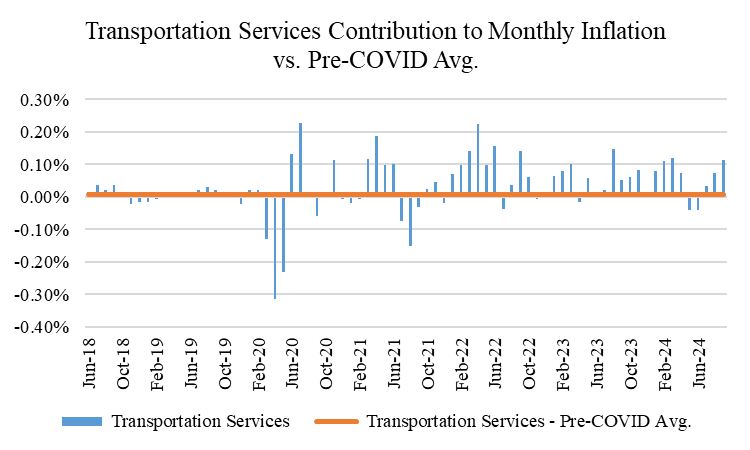
Transportation services was also a large contributor to core services this month, as it has been for most of the post-COVID era, and as we'll see in a moment, holds within it the source of much of the disappointment in the September report. This month this large category of services contributed +11 bps to the core services number of +17 bps. This is a 6 month high for this category, though not necessarily out of step with post-COVID trends (it IS, however, substantially out of step with pre-COVID trends).
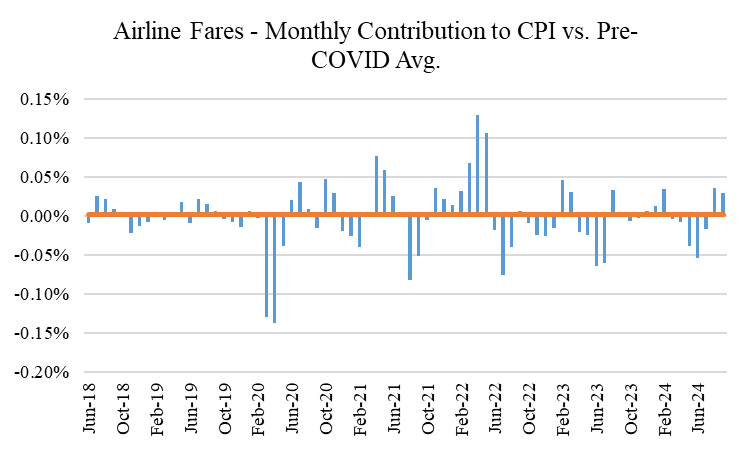
Can we tell what's driving the greater inflation within transportation services? Yes and No. Within transportation services, airline fares and car insurance were two notable contributors this month, contributing +3 and +4 bps respectively of the +11 bps overall contribution from transportation services. As the airline fares chart shows below, airline fares have been pretty volatile for the last three years (similar to how they were pre-COVID). This month's contribution from that sub-category can therefore more easily be chalked up to excessive "noise" than "signal."
We've talked about car insurance at length in prior months' posts, but this month saw a tick back up to what has been excess contributions from car insurance since early 2022. We've argued in prior months' posts that car insurance prices are unlikely to be sustainably inflationary to this degree going forward. This is because insurance prices tend to correlate with:
the value of the underlying assets that they're insuring and
the risk of that asset's potential destruction (and thus the odds of a claim being filed)
While we can argue that factor #2 above is likely being impacted by climate change, it is likely to be much less so than houses (which can't simply be driven away, which you can with a car). I'm therefore more skeptical climate and other environmental factors are either creating significantly greater inflation in autos today, or that they will create structurally higher inflation for auto insurance going forward either. But again, we'll see.
If used car prices are no longer inflating, and there isn't materially higher risk of claims being filed (if anything, car safety features seem to be causing downward pressure on claims more than climate is causing upward pressure), then car insurance prices should (eventually) start to follow car prices again.
The next chart tries to contextualize this by showing the spread between used car prices and their monthly contribution to core inflation, relative to car insurance's monthly contribution. Notice how there wasn't much of a consistent trend pre-COVID (which isn't surprising since both were generally not inflationary, and typically contributed about +0 bps a month to core inflation). The spread was basically just noise.
Now notice how there were huge spikes on the positive side of zero for a good chunk of 2020 and 2021 (indicating used car prices were inflating well above car insurance prices in CPI), and then how (considerably) this has reversed in the second half of 2022, 2023, and 2024. This is the lag or "sticky" effect of car insurance inflation catching up to car price inflation during COVID. Used car price increases have now subsided, however, and in many months have even been de-flationary in many regards.
As the next chart below shows, however, car insurance prices have now drastically exceeded the changes in car prices themselves since COVID began. To be sure, car insurance prices are also tied to other things, most notably the cost to repair vehicles. Body shop costs too have gone up considerably, though it's not clear they're up 50%. Regardless, the gap that's emerged between car prices and car insurance price changes since the start of COVID portends to a slowdown in car insurance prices sooner rather than later (especially considering body shops may be overstaffed now). This is also considering that new and used car prices have a 73.5% and 30.1% R-Squared in predicting insurance prices since 2000.
If airlines and car insurance contributed +3 bps and +4 bps respectively, this leaves +4 bps contribution from everything else within transportation services (so transportation services excluding airline fares and car insurance). As the chart below shows, that bucket of categories has bounced around pretty considerably, both pre-COVID and post-COVID, though it has been much more consistently inflationary post-COVID. This probably lends itself to this group of sub-categories being a mixture of both this month: "noise" and "sticky." Because we can't get quite as much into the nitty gritty there though (the BLS doesn't provide all of the sub-category components here), it's hard to bifurcate what's signal and what's noise.
If we had to make a guess then on what we could comfortably look through and "ex-out" from transportation services, it's probably at least 6-7 of the +11 bps from this month. As a reminder, we do this to try and get an estimate of what true "run-rate" or "long run" inflation is in the economy. This adjustment would imply that core services "run-rate" from this month would probably look more like +10-11 bps compared to the +17 bps we reported. This is still above the pre-COVID average of +7 bps, but less so, and more consistent with 2% inflation. If you think this is fair, then consider the following math:
around zero (+0 bps) inflation for goods
+9 bps for shelter
+11 for core services
All of which = +20 bps. This annualizes to about 2.4% inflation in the CPI. Adjusting for the difference between CPI and PCE (the Fed's preferred inflation benchmark), which historically is 30-50 bps, PCE is probably more like 2.1%, or right in-line with the Fed's target.
If you feel like we're picking and choosing categories, you're not entirely wrong. There are (as there always are) categories that are noisy and that bounce around each month both ways. Lodging away from Home, including hotels and motels, was a good example of this this month, which contributed -4 bps in September. This is at the lower end of their contribution range, and thus, if you normalize for this, this eats into some of the adjustments we made above. Thus, there's definitely noise in categories that cuts both ways. Said differently, the noise wasn't all bad this month, but it seems like more of it was than wasn't.
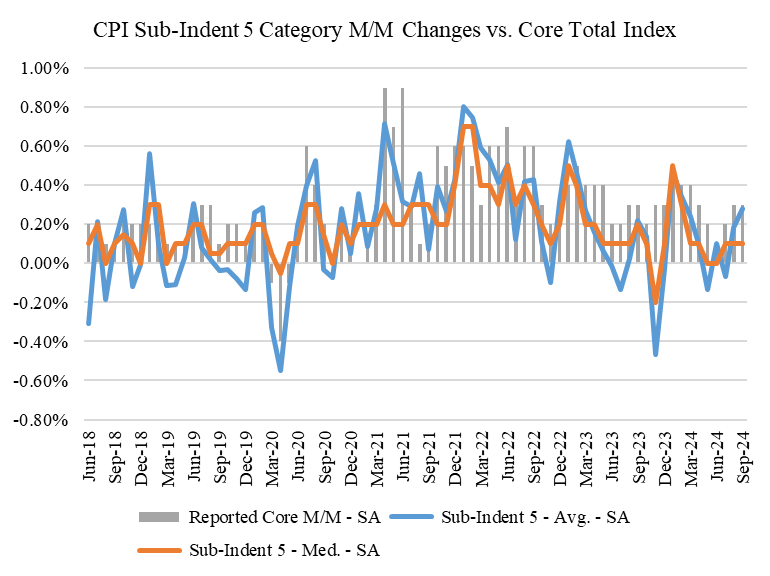
This is why I always find it helpful to look at the average and median increases across categories to get a better sense of inflationary breadth. If the average and median rates of inflation are consistent with 2% inflation, then we need not stress about individual category noise. A comfortable level is around 0.20%, or +20 bps a month.
This month, Category 4 and Category 5 Level goods and services saw average price increases of 0.27% and 0.28% respectively, and each of those saw median category price increases of 0.10% as well. As a reminder, Category 4 Level goods and services are a group of 55 baskets of goods and services that comprise about 98% of the core CPI. Category 5 has more baskets (101), but covers less (78%) of the core CPI.
As you can see from the charts below, one month clearly does not make a trend, but 0.27% and 0.28% are the highest these average figures have been since late last year and early this year, which isn't what we want to see (especially since those rates are more consistent with 3% inflation, rather than 2%). The good news is that the median increases are quite a bit lower and very consistent with 2% inflation. Bottom line, we like to show this category level data so that all the one-off or two-off category analysis we did above can be more broadly assessed to decipher inflationary breadth. And this month, inflationary breadth took a step backward.
Lastly, here's the same data on a 3 month average basis, annualized. This month's report definitely brought the lines up closer to the bars (hence the comment about taking a step back in inflationary breadth this month), but category level inflationary breadth on a 3 month basis is still very much consistent with 2% inflation.
In summary, this month was not a great inflation report, and the worst one we've seen in several months. That being said, it by no means was sufficiently bad enough to meaningfully alter the Fed's rate cutting plans (though it may take one rate cut off the table for this year). The economy is still softer than economists think, and inflation is still quite a bit better than almost anyone else (besides the financial markets) thinks too. Given that inflation is still very much "on the path back down to 2%," the Fed can stick to its plan to continue reducing interest rates back to more of a "neutral" level. Could this change next month? Perhaps, but until we get at least two more reports like this month, we're still in a good spot for a soft landing with continued disinflation. In that regard, September 2024's CPI report is likely to end up being "noise" rather than "signal."






Comments